
|
As another year of the lake warming experiment is now behind us, let’s look back at some of the results from year two. We had a very fruitful year with our experimental warming, despite the cool and windy “summer” weather. This summer was much cooler than the previous summer (about 2-3°C colder on average) which can certainly make our attempt at warming a 3.5 hectare, 20 meter deep lake all the more difficult. In addition, there were numerous days throughout the summer where wind gusts were well over 10m/s. Given the correlation between air and water temperatures, it’s fairly easy to understand that these low air temperatures caused the lake water temperatures to be cooler relative to last year. Similarly, high winds can also greatly influence lake water temperatures by increasing mixing between warmer surface waters (epilimnion) and colder bottom waters (hypolimnion; typically remain at 4°C all summer long), eventually leading to a reduction or breakdown in stratification within the lake leading to lower water temperatures. In fact, one of these unseasonably “winter-like” storms (low temperatures and high winds) hit our study lakes mid-July, shortly after warming efforts began and partially mixed all of our study lakes. Nonetheless, our team successfully ran our three warming units non-stop from July 13th until August 31st (44 days). These units were constantly pumping out water 10-15°C warmer than ambient water temperatures (Fig 1). At four meters depth, or about the middle of the epilimnion, water temperatures were, for a period of time, 2-3°C warmer than in our best reference lake (Fig 2). Throughout the entire warming period, average epilimnetic water temperatures were ~1-2°C higher in our experimental lake. This resulted in a larger, warmer epilimnion denoted by the red/orange/yellow regions in Fig 2. This difference in water temperatures may seem relatively subtle, this resulted in over 127,543 m3 (or 1.3 x 10⁸ L) of water that was 1-3°C warmer in our experimental lake than in our best reference lake! Our experimental lake has a small outlet where temperatures were recorded all summer long. Due to lower density than cold water, warmer water sits at the surface of lake and thus, it may be that there is a flux of this warmed surface water exiting our lake through this small outlet. Indeed this is exactly what we observed; the water trickling out of the outlet of our experimental lake was up to 2+°C warmer than the outlet of our best reference lake. Yet another sign of our experimental warming was the higher stability of the thermocline in our experimental lake relative to our best reference lake. Stability is a metric that refers to the resistance to physical mixing due to the potential energy inherent in the stratification of the water column. This stability is a result of the difference in water temperatures between the epilimnion and hypolimnion, the larger the difference, the higher the stability. Thus, warmer lakes will have higher stability compared to lakes with lower epilimnetic temperatures. The stability of the thermocline in our experimentally lake was ~2x higher than our best reference lake throughout the warming period. This increase in stability was due to the warmer epilimnetic temperatures in our experimental lake and resulted in our experimental lake being stratified for 15 days longer than our best reference lake (Fig 2). Eventually, as happens at the end of every growing season in the Arctic, the rapidly dropping air temperatures, lack of sun, and high winds resulted in our experimental lake completely mixing (turning over) on Sept. 1st which marked the end of our warming efforts for the 2018 season. Together, the increased water temperatures, increased outflow temperatures, increased stability, and longer period of stratification observed in our experimental lake served as important indicators of our successful warming efforts during the 2018 field season. We hope to make the lake even warmer in 2019 with more heating improvements, and with any luck, a year in which the weather works in our favor (i.e., an average or warmer than average year)! We also have some exciting results from the modeling portion of our research. Drs. Jiming Jing & Sarah Null (Utah State University) are interested in simulating and projecting lake temperature dynamics using coupled lake-climate models. We have vastly improved the physically based lake scheme embedded in Community Land Model (CLM) version 4.5 by incorporating an oceanic mixing function to predict the summer stratification and thermal regime (including mixing) in all four of our research lakes. In the original CLM lake scheme, the wind is the only factor that drives the lake mixing processes. However, the improved lake scheme with the oceanic mixing function considers multiple factors that affect the water mixing such as surface heat fluxes and density gradient besides the wind. This lake scheme with a 10-layer structure also simulates detailed processes of ice cycling. Driven only by environmental data, the improved CLM lake scheme is mimicking observed mixing processes and thermal conditions in the lake when compared to the original lake scheme (Fig 3). In addition, the discrepancy between observed and predicted in the temperature-controlled lake appears to be due to the manipulated warming, especially later in the season. Importantly, such a discrepancy was minimized if a heat flux of 18 W/m2 was added to the mixing layer (e.g., experimental warming; Fig 3). These improvements to our models now gives us the ability to simulate thermal dynamics of a wide range of arctic lakes and also gives us the ability to project into the future by feeding in projected future climate data and better understand how climate change will affect the thermal dynamics of arctic lakes. Along with our whole-lake manipulation, our team is also initiating complementary smaller scale experiments to better understand how arctic organisms may respond to a warming climate. This includes experiments with microbes (Dr. Byron Crump & PhD student Natasha Christman) as well as experiments with fish. Due to the temperature-dependence of nearly all physiological processes, climatic warming will likely lead to substantial modifications to individual ectotherm performance with consequences culminating at the population, community, and ecosystem levels. In addition, demand for resources will increase with climatic warming due to increases in metabolic demand; as such, the effects associated with climatic warming may be modulated by resource availability. I performed one such set of experiments this past summer at Toolik Field Station. The goal of this study was to investigate the independent and interactive effects of temperature and food availability on slimy sculpin (Cottus cognatus), an abundant mid-level consumer within many arctic lakes, and one that functions as a predator, competitor, and prey source. To accomplish this goal, we used a factorial experiment manipulating temperature (three levels; low (7°C), medium(12°C) and high(17°C)) and food availability (two levels; low and high). We chose the temperatures based on current and projected lake water temperatures as well as the optimal temperatures of slimy sculpin. In summary, our results indicated significant increases in consumption, excretion, and respiration rates with increases in temperature (Fig 4). In addition, when food was not limiting (i.e., high food treatment), growth increased significantly in the medium temperature treatment; however, when food was limiting (i.e., low food treatment), growth decreased with increasing temperatures (Fig 4). With changes in slimy sculpin growth and overall performance, we expect there to be important consequences for top predators such as Lake Trout (Salvelinus namaycush) and Arctic Char (Salvelinus alpinus), which rely on sculpin as a prey source. Furthermore, responses such as decreased growth may be particularly detrimental for individuals in low-grade environments or populations that must overwinter, as is true in the Arctic. Our results indicate the importance of considering the interaction between temperature and resource availability when evaluating the likely effects of climatic warming on individuals, populations, communities, and entire ecosystems. This concludes the summary and reflections from the previous year of the lake warming experiment. I thank all of the hard-working members of our team and our collaborators for another wonderful year! We are all excited to continue and increase our warming and monitoring efforts next year! Be sure to stay tuned for further updates. 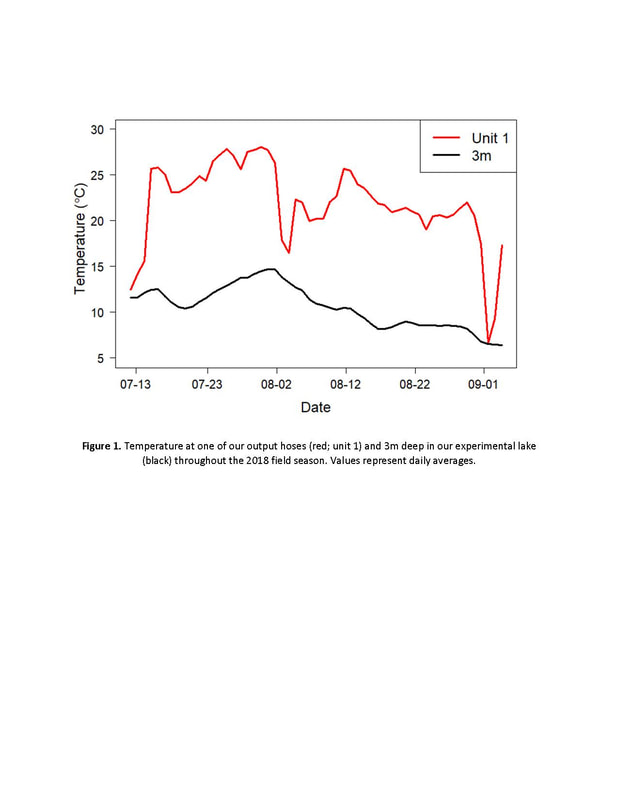 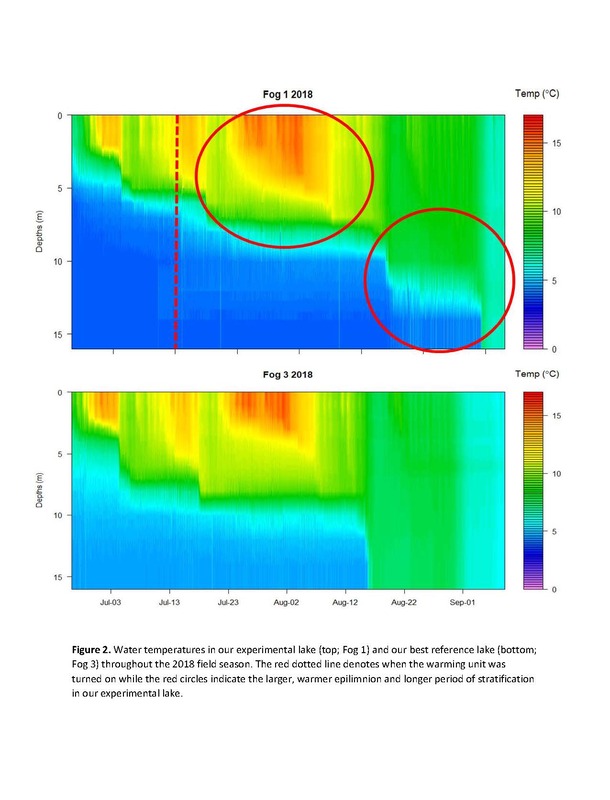 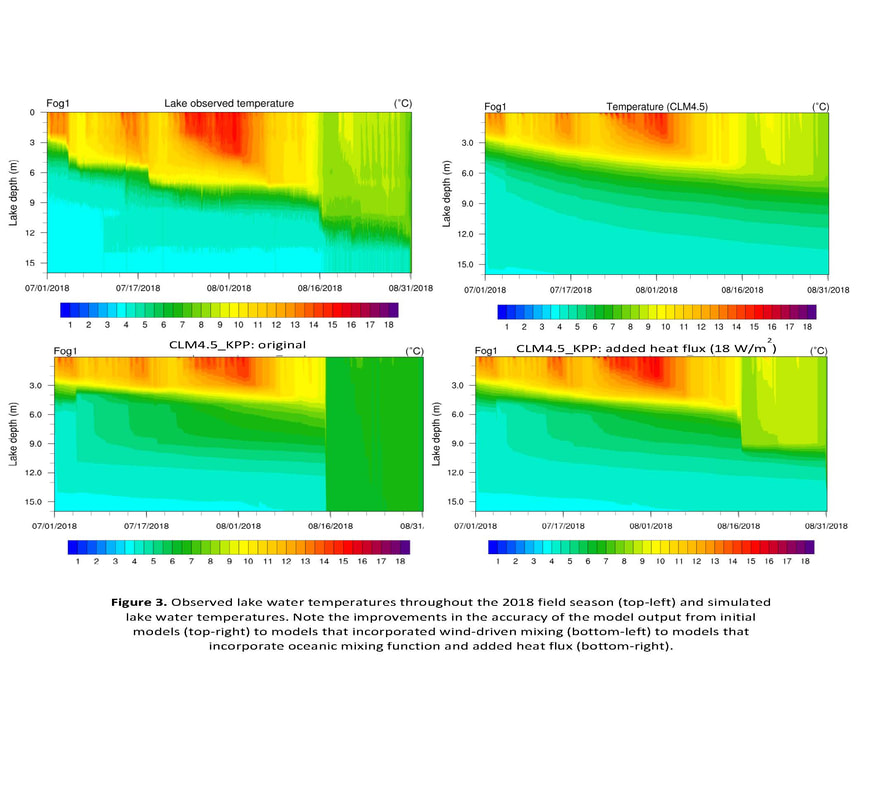 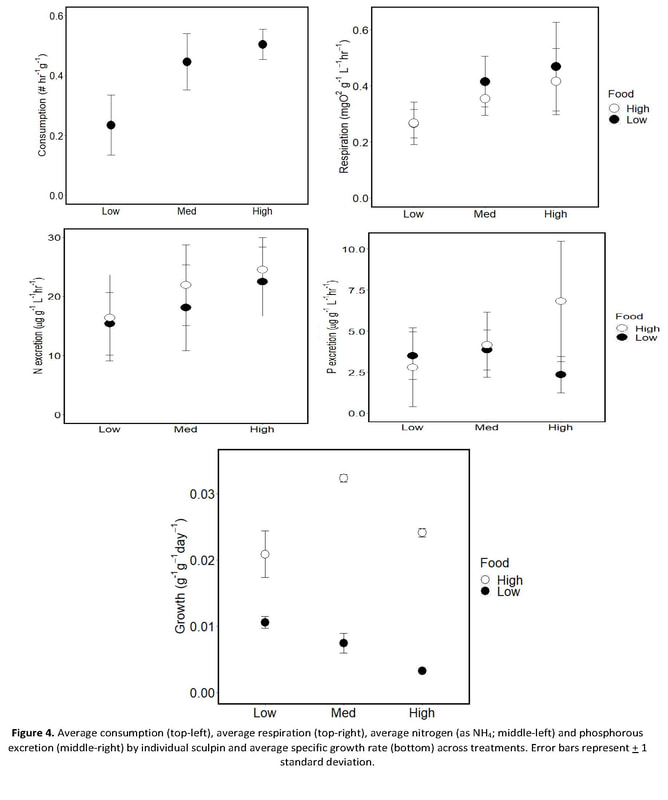
42 Comments
Year two of the lake warming experiment is well underway and our team has been staying very busy with sampling, setting up and tending to the warming equipment, and slinging propane. Last summer on the North Slope was very dry and warm, particularly in June. However, this summer has been much cooler and wetter thus far, with the pleasant sunny days few and far between. This difference in weather patterns year-to-year highlights the high degree of inter-annual variation in the Arctic climate, a topic that is of particular interest to our research. The long-term sampling done by the ARC-LTER based out of Toolik is instrumental in tracking how organisms and ecosystems respond to changes in the environment overtime, not only year-to-year, but also over decades. Data obtained by the LTER sampling regime will allow us and other researchers to gain a better understanding of how these arctic ecosystems will respond to changes in climate. As for the lake warming experiment, our team (Peter MacKinnon, Gary P. Thiede, Tyler Arnold, Ryan West, and myself) began setting up the warming units in early July. As a recap, our warming units consist of eight 100-gallon propane tanks, a propane powered generator which powers a pool pump and a large water heater. Alterations to these units from last year include two more tanks per station, new heaters, and different generators. In addition, this year we have shifted all of our warming efforts to Fog 1, which now has three warming units located on the north and west shores. A spatial layout of the location of our units and large water circulation instrument (SolarBee) is provided in Figure 1. The process carried out by our warming units involves pumping water from a shallow intake hose and then sending this water through the heater and back out into the lake via a long output hose set about 3m below the water surface. Our first few propane slings of the year have gone very smoothly, with many thanks to Pollux aviation and their great coordinators and pilots. Our slings consist of moving 24 full tanks (~650 lbs.) from a turnout off the Dalton Highway to the warming units and 24 empty tanks from the warming units to the road turnout to be re-filled by Crowley Propane. These slings will take place every 4-5 days for the majority of the summer. After a chilly start to the season, we are excited to announce that the warming equipment has been turned on as of 7/14 and warm water is flowing into Fog 1! Currently, the three output hoses are rapidly sending heated water that is about 26°C (more than 10°C above ambient water temperature) into the lake. Temperature profiles obtained from our temperature loggers deployed in each of the Fog lakes are instrumental in tracking thermal dynamics in each of the lakes overtime. Using this data we will be able to track changes in water temperature between our experimental (Fog 1) and reference lakes (Fog 2 & 3). Temperature profiles over time in the form of heat maps are provided in figures 2 & 3. Currently, Fogs 1, 2, and 3, are stratified between 7 and 9m deep. Fog 5, the smaller, shallower lake is currently stratified at about 2m deep, however, this lake has experienced a couple mixing events in which the entire lake became isothermal (equal temperatures throughout the water column). We’ve experienced two substantial wind storms so far this summer where gusts topped out at over 12m/s. Evidence of these wind storms on July 4th and 18th can be seen in the temperature profiles with the deepening of the thermoclines in Fogs 1, 2, and 3 and full mixing of Fog 5. Wind events like we’ve seen here play an important role in lake mixing and can quickly breakdown the density gradients between the warm and cold water, resulting in weakening and/or deepening of the thermocline and even full lake mixing events. Despite the cool and windy weather patterns, the epilimnetic water temperatures of Fog 1 are currently 0.5-1.5 °C warmer on average compared to the reference lakes Fogs 2 & 3. We shall see how these patterns in water temperature pan out for the remainder of the season. Our fieldwork and sampling this season kicked off with setting up our climate stations and de-winterizing our buoys and temperature chains on each of the Fog lakes. Our climate stations are set up on the shore of the lakes and collect data on wind speed and direction, air temperature, humidity, solar radiation, and photosynthetically active radiation (PAR). Our buoys and temperature loggers have overwintered under the think arctic ice and must be pulled up, downloaded, reset with more loggers, and redeployed (i.e., de-winterized). This season our NSF REU (Ryan West) and I had to wait until enough ice melted from the lakes before we could obtain these temperature loggers and re-set our buoys for the summer season. Last summer the Fog lakes were ice-free by mid-June, however this season we had to wait a couple more weeks until the lakes were open. After downloading the data from the temperature loggers, we re-set the buoys with more temperature loggers (every meter) which will provide high-resolution data on the thermal dynamics within each of the Fog lakes. We also deployed three MiniDOT dissolved oxygen loggers set in the epilimnion (surface waters), metalimnion, and hypolimnion (bottom waters) of each lake. The data provided by these MiniDOTs will be used to estimate ecosystem metabolism, which represents the balance of the uptake and production of oxygen and carbon dioxide through photosynthesis and respiration. Ecosystem metabolism and the balance between primary production and respiration is predicted to change as a consequence of warming due to the temperature-dependence of cellular processes. Changes in ecosystem metabolism have the potential to alter ecosystem function, productivity, and food web dynamics. Understanding how warming will affect ecosystem metabolism in arctic lakes is a topic of my dissertation research. Ryan and I also performed early season sampling for benthic macroinvertenbrates and stable isotopes on each of the Fog lakes. This consisted of eckman grabs from shallow (0.5m), intermediate (3m), and deep (7m) depths and performing snail transects via snorkeling. Within these arctic lakes benthic marcroinvertenbrates such as snails, chironomids, and trichoptera are very important food sources for arctic fishes such as arctic char, lake trout, and arctic grayling. The response of arctic fishes to warming will be highly dependent upon the response of their food source. Therefore, investigating changes in macroinvertebrate communities in response to warming will be paramount in understanding how arctic fishes may respond to a changing climate. In addition, we sampled the Fog lakes for stable isotopes. Stable isotopes of carbon and nitrogen can be used to construct and assemble aquatic food webs and provide information on where (carbon) and what (nitrogen) organisms are eating. This sampling consists of collecting organisms from each level of the food web including benthic algae, phytoplankton, benthic macroinvertebrates, zooplankton, small fish such as slimy sculpin, and fin clips from larger arctic char. This stable isotope data will be used to track changes in aquatic food webs overtime, including what and where the organisms are eating. For the remainder of the field season (until late Aug/early Sept.) our team will be staying busy sampling, slinging, and tending to the warming units so be sure to stay tuned for more updates throughout the season! Also, be sure to check out the pictures from this field season (as well as the previous season) in the pictures tab. 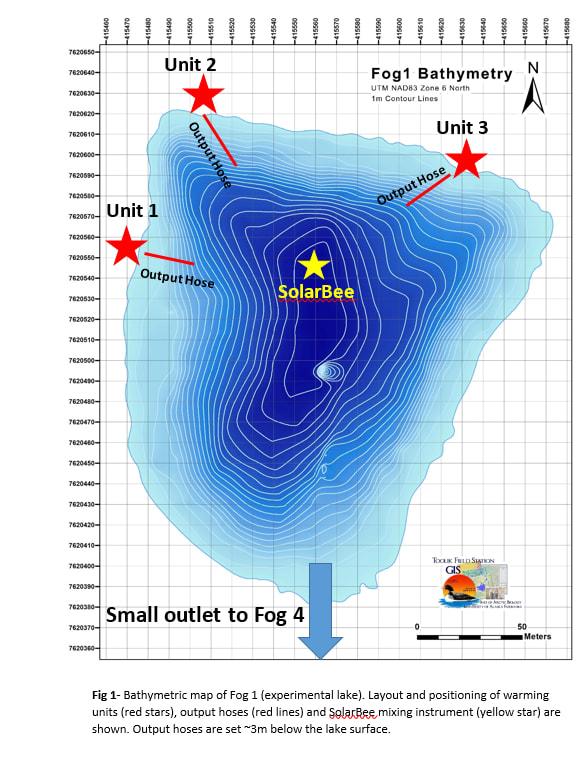 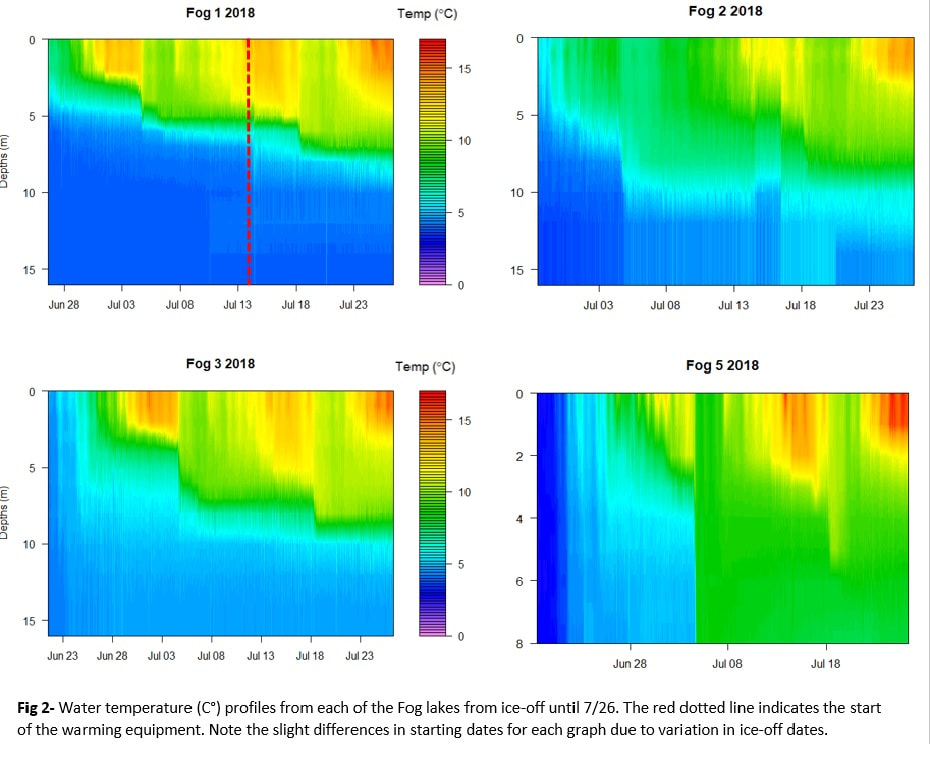 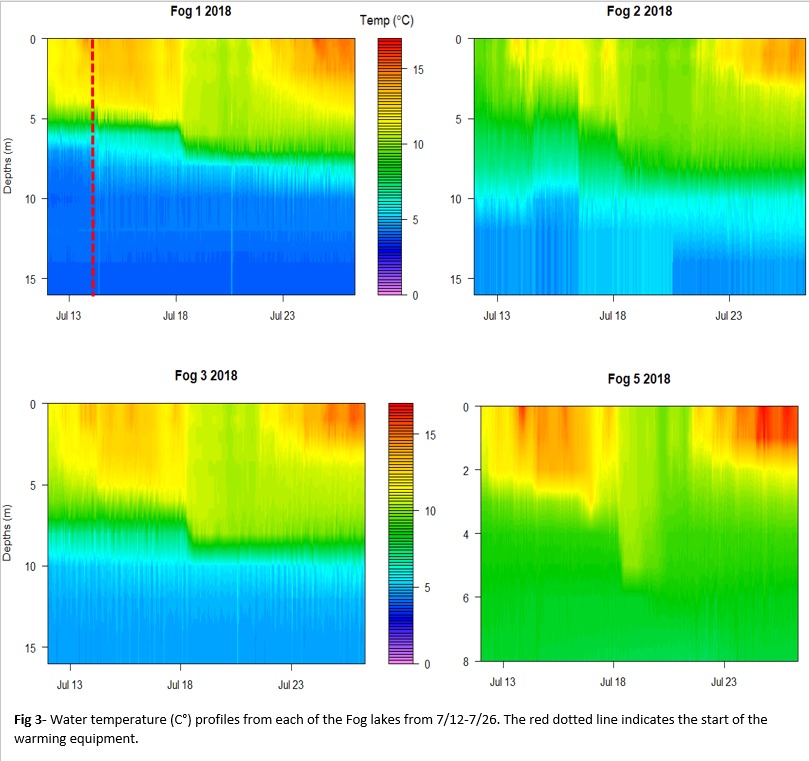 Year one of the lake warming experiment provided our team with endless opportunities to learn about what works and what doesn’t work when trying to warm whole lakes off the grid in Arctic AK. At the end of the last blog post, we indicated two of our three warming units were turned on and warmed water was being pumped into our lakes. Unfortunately, due to technical difficulties with the generator, the third unit remained inactive. When the units were initially turned on, the weather had been warm and winds calm. This allowed for ideal conditions to start our lake warming, surface water temperatures were very warm, and the lakes were strongly stratified. However, shortly after turning on the units the weather took a turn; temperatures decreased drammatically and winds picked up. This resulted in unfavorable conditions for warming, including decreased water temperatures and increased mixing. In addition, we encountered numerous mechanical difficulties (i.e., learning experiences) throughout the summer driven by the malfunctioning of generators and heaters. As a result, the delivering of warm water into our lakes was inconsistent over time. That said, many of the issues we confronted have now been addressed including simply learning which types of generators and pool heaters work best in this situation. We also learned a lot about the most efficient strategy for switching out the propane tanks that power our warming units. After 4-5 days of operation, the 100-gallon propane tanks are switched out via helicopter. By the end of the season, we perfected the art of propane switch-outs, completing the entire process of shutdown, switch-out, and power on in less than an hour. We now feel poised and confident to warm the larger lake this upcoming season (discussed further below). In order to track the input of warm water into our lakes, we mounted temperature loggers to the end of our output hoses, which carried the warm water from the heaters and delivered it in to the lake. Figure 1 (downloadable file provided below) displays water temperatures at the outputs hoses and compares these to the water temperatures at one and two meters below the surface. As you can see, we were successful in pumping warm water into our lakes. However, as the figures indicate, there were numerous interruptions in the deliverance of warmed water into the lake. Nonetheless, the warmed water ranged from ~4-10°C warmer than the water in the lake. The thermal regimes of the “warmed” lakes and the reference lakes were very dynamic in 2017. Figure 2 displays water temperature profiles from within each of the Fog lakes throughout the summer. These plots clearly display the thermally stratified layers within our lakes. The epilimnion is indicated by the yellow and green colors (~13°C and above), the hypolimnion in green and light-blue, while the hypolimnion is in darker blue. As you can see, throughout the summer months the temperatures and stratification within our lakes are quite dynamic, particularly in the epilimnion. Furthermore, the epilimnion became deeper over the course of the summer. Eventually, the cold temperatures and wind lead to the thermally stratified layers breaking down and full mixing of the water column (occurred during late Aug). In Figure 2, Fog 1 and Fog 5 represent our experimental lakes while Fog 2 and Fog 3 served as references lakes. Although we can see the signal of the warmed water in the epilimnion soon after the lake warmers were turned on, the extremely cold and atypical weather and air temperatures, in addition to an unanticipated mixing event, minimized the whole lake effects of warming. Despite all of the time spent implementing and working with the lake warming equipment, we did manage to get a large amount of sampling done on the Fog lakes. Throughout the summer the lakes were sampled by the "limnology crew" headed by Dan White. This crew takes weekly measurements of various physical and chemical parameters, including temperature, dissolved oxygen (DO), nutrient concentrations, pH, conductivity. The limnology crew also takes samples of the phytoplankton and zooplankton within the lake. The Fog lakes were also sampled for benthic invertebrates (e.g., caddisflies and snails), stable isotopes (for food web analysis), and fish (However, our most successful fish sampling is performed through the ice in mid-May). In addition, the temperatures within our lakes were closely tracked using a profile of temperature loggers that logged water temperature at a given depth every hour. Eventually, all of this data collected from the lakes will be added to the massive ARC-LTER database and used to better understand the ecology of these systems. Furthermore, This data will be paramount in tracking changes in these important lake characteristics over time. As part of my dissertation research, I am interested in understanding how warming may affect the availability of suitable habitat for fish as well as ecosystem-scale processes such as lake metabolism. Warming may lead to substantial reductions in suitable habitat for arctic fishes through increases in surface water temperatures and reduced levels of DO (i.e., hypoxia) in hypolimnetic waters (leading to a “temperature-oxygen squeeze”). To begin to look at this more closely, we quantified the volume of unsuitable habitat (temperatures >15°C & DO < 5mg/L) for Arctic Char (Salvelinus alpinus) using three-dimensional temperature and DO profiles. Figure 3 and Table 1 show that both increased temperatures and decreased levels of DO can lead to significant reductions in suitable habitat for Arctic Char. A combination of increased temperatures, prolonged stratification, and hypoxia lead to the largest reductions in suitable habitat in Fog 5 (up to 73% during the summer of 2017). Consequently, fish will need to locally adapt to changing conditions to avoid negative consequences such as reduced growth and survival. Future work will include the collection of more data in order to analyze these relationships further and to develop models that can be used to predict warming-induced reductions in habitat for multiple species of fish found on the North Slope. Due to the temperature dependence of physiological processes at the cellular level (photosynthesis and respiration), warming may also have substantial effects on important ecosystem processes such as lake metabolism. Furthermore, by calculating lake metabolism we can gain valuable information on food web structure, carbon dynamics, sources of energy, and overall productivity of these systems. In order to calculate estimates of gross primary production (GPP), ecosystem respiration (R), and lake metabolism (NEP), this summer we deployed sensors to continuously track changes in DO (10-min time steps) in the Fog lakes. Figure 4 shows preliminary estimates of GPP, R, and NEP from each of the Fog lakes. In general, these lakes display low productivity, reflecting their oligotrophic state. However, Fog 5 displayed higher levels of productivity, likely due to it’s morphology, low position in the landscape, and higher levels of organic matter. This may suggest that more productive (i.e., higher rates of GPP & R) systems such as Fog 5 may be particularly responsive to climatic warming. Future work will include more data collection during subsequent field seasons and model development in order to evaluate the affects of warming on lake metabolism As year one came to a close and our lakes began to form ice a thin sheet of ice, it was time to shutdown, clean up, thank our wonderful crew for all of their hard work, and prepare ourselves for year two. Despite some of the roadblocks encountered, we couldn’t be more excited and anxious to start year two. We learned an incredible amount during year one and by using the knowledge gained and applying it to our efforts moving forward, we are now fully prepared to take on year two of the warming experiment. In addition, our team has hired a full time lake warming technician (Tyler Arnold) who’s sole responsibility will be managing our warming units and keeping that warm water pumping. Furthermore, our team has decided to slightly alter our plan of attack. This summer we plan to house all three warming units at Fog 1 and therefore concentrate all of our warming efforts to this lake. Plans are to begin set up of the equipment in Late May/early June so that it will be ready to be turned on when the conditions within the lake are most ideal (i.e., warm surface waters and strong thermal stratification). Thanks for your interest in our project and be sure to stay tuned for updates during year two!
 As always, check out the “photos” tab to get a visual experience of this past week and our summer of 2017 on the North Slope. This last week or so has been an exciting one. Unfortunately, the warm and dry summer has seized to continue here up at Toolik. Much of the last week has been filled with cooler temperatures, wind, and rain. Despite this turn in weather, the work carried on. On Monday, Thomas and I did some sediment coring from Fogs 2, 3 with Kristen, and safe to say things got a bit messy, but the cores came to the surface beautifully. These cores were then incubated in lab to measure production and respiration (i.e., production and uptake of oxygen) from the sediments. After coring, Thomas Hafen and I had a few extra hours to kill in the afternoon, thus we sampled fish for a bit on Fog 1. We caught a few Arctic Char (only Char and Slimy Sculpin occupy the Fog lakes) including a recap. A recap is a fish that was already caught and tagged with a unique identifier in the past. Taking a peek into our records, I discovered that this particular char was caught late last Aug and grew over 20mm and about 90g since then. Must have been quite the year of feeding and assimilation for this char. On Tuesday, Thomas and I leveled the platforms which will house the propane tanks at Fog 1,5 to get them ready to support those heavy tanks and other equipment that are soon to be delivered. We also downloaded our temperature loggers from the Fog lakes. These temperature profiles reflected the warm air temperatures that occurred the previous weeks. Surface temperatures of the Fogs approached 18-19°C during the warmest times of the week, which is about as high as the water temperatures get up here. These warm surface (epilimnion) temperatures persisted until about 3-4m, until they started to decrease substantially at the thermocline, indicating stratification in the lakes. The thermocline of the deeper Fogs 1,2,3 was at about 4.5m where the temperatures dropped 4-5°C in just a single meter, evidence of a strong separation between the epilimnion and hypolimnion. Fog 5, being the smaller more shallow lake had a thermocline that was about 1m or so more shallow than the larger Fogs. Beneath the thermocline, there was very little change in temperature. However, as mentioned above, the temperatures have cooled off since, and the wind has increased. These changes in the weather will likely have repercussions for the water temperatures of the Fogs; we shall see next time we download the data. Late Tuesday evening the rest of the Lake Warming team arrived from Utah. This included my advisor, PI on the project, and co-head of the LTER Lakes group at Toolik, Phaedra Budy as well as Co-PI Sarah Null and her MS student Thomas Balkcom, and researchers Gary Thiede and Peter MacKinnon. Work with this great crew continued for the remainder of the week. This included moving all of our equipment and setting the stage for the warming to begin. This involved ~7 sling loads via helicopter the first day alone. Thanks to CPS and Pollux Aviation and their great pilots, this task was a breeze. One of these sling loads included the core of the large Solarbee lake mixing instrument, which looked much like a UFO effortlessly floating through the air. Check out the photos. A pyranometer (solar radiation), temperature, and relative humidity sensor were also added to the Fog 1 weather station. This is important for understanding the heat budget for the Fog lakes and the data will primarily be used by Sarah and Thomas B for the modelling portion of this project. Thursday proved to be quite the day. After working away during the morning and eagerly waiting, our 48, 650 pound full propane tanks arrived from up the haul road during the afternoon. All 48 of these tanks were slung via helicopter after arrival, 24 being left near the lakes ready for replacement, 12 brought to two Lake Warming Units at Fog 1 and another 12 brought to one Lake Warming Unit at Fog 5. Wednesday thru Monday included long, wet days spent setting up the warming equipment on Fogs 1, 5. This included putting the Solarbee together and launching it from shore, hooking up the propane tanks, building larger and more elaborate add-ons to the platforms and housing area, situating the pumps, generators and heaters and preparing these items for the task of warming up our lakes. Each Lake Warming Unit is composed of 6-12 propane tanks, one propane generator, one heat pump, and a water pump. The intake pump propels the water through heated coils, and then this warmed water is sent back out into the lake via a deeper pump hose. In theory, this process is similar to heating a large (very, very large in our case) swimming pool. The water is currently coming out between 70 and 90 degrees F, but varies substantially with the flow. The recently deployed Solarbee (water mixer) is designed to circulate water up from a specified depth and distribute it out across the surface layers. At the level of intake the water is drawn in from all sides and forced upward and then propelled outward over the distribution dish at the surface, providing gentle mixing of the water column. The Solarbee is an efficient unit to operate given that it obtains all the energy it needs from the sun via three large solar panels mounted to its frame. To learn more about the Solarbee, how it operates, and potential applications, be sure to visit www.medorace.com. Currently, our Solarbee is pulling water from 4 meters (the top of the thermocline) and distributing it to the top of the water column. Also, it is attached to our bouy and anchors using a 15 meter tether which allows it to gently move around our large lake while mixing. After this week of hard work from the entire crew, including the helicopter pilots, a very important milestone occurred yesterday (Mon the 24th). Two of the three Warming Units were turned on, and the Solarbee (water mixer) officially started, marking the beginning of the lake warming experiment. The equipment will need to be continuously checked and maintained in order to assure they are properly pumping and warming. We are excited to see how our efforts will be reflected in whole lake temperature and more importantly, ecological and ecosystem changes. For the coming weeks our focus will be maintaining the equipment, developing a troubleshooting protocol, and putting the finishing touches on the warming stages. In addition, we will continue to monitor ecological conditions and states at all trophic levels. Thanks for tuning in to another update, hope to have another update within the next week filled with great news and of course more of our adventures from the North Slope. 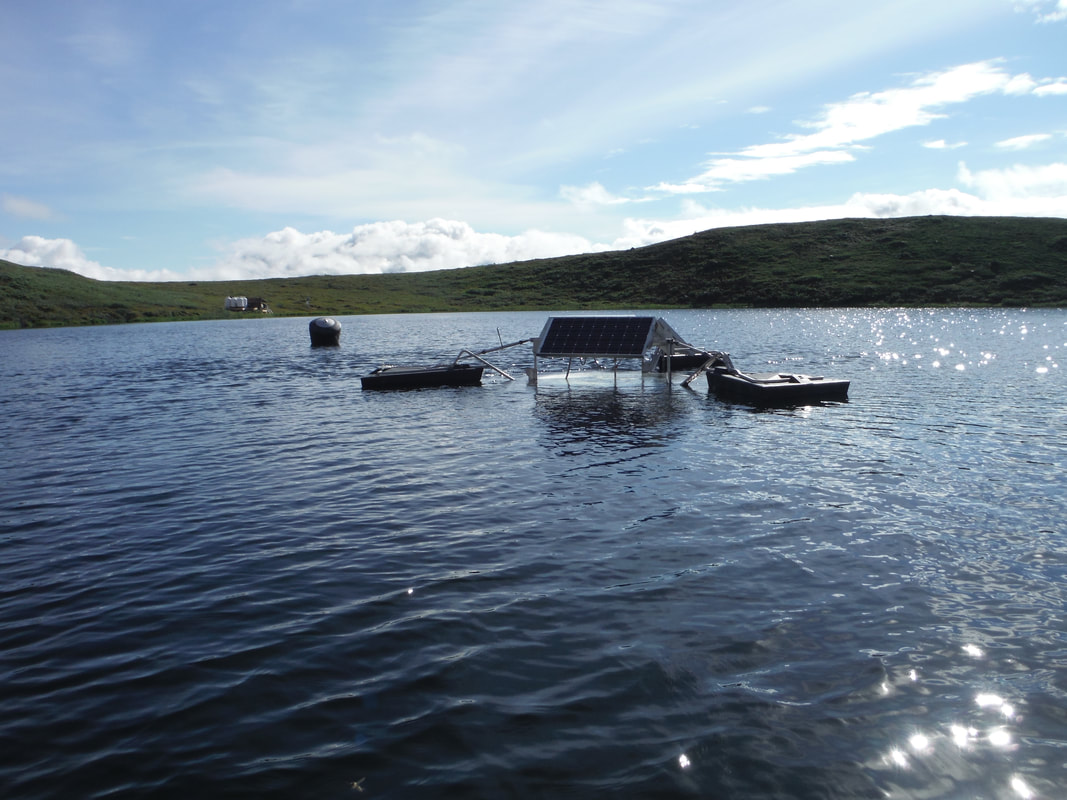 Heads up, some pictures related to this blog and our week are posted in the “photos” tab, check ‘em out! Another week in the books here at TFS and as you may have guessed, it was filled with plenty of adventures. We began this week by collecting samples from each of the Fog lakes for stable isotope analysis. Stable isotopes (in our case 13Carbon and 15Nitrogen) are a great tool for ecologists and provide insightful information about the structure of the food web. Basically, it is a fancy way to see who eats what. For a brief and quick overview, these carbon and nitrogen isotopes regularly occur in nature (plants, microbes, animals, etc.) but in relatively low concentrations. Because you are what you eat, as you move higher up the food web towards top predators, the organisms occupying higher trophic levels have higher amounts of these carbon and nitrogen isotopes incorporated into their tissues compared to their prey (they obtained the isotopes from ingesting multiple prey items). Variations in isotope ratios and the relative amounts of these isotopes within a given organism make up its unique isotope signature. The difference in isotopic signatures between organisms is predictable based on trophic level/what they eat and thus the trophic status of an organism (producer, consumer, top predator, etc.) can be determined using stable isotope analysis (whether they have more or less 13C and 15N). These analyses will be useful in determining the sources and links in the food webs of the Fog lakes and how they may change overtime (season to season and/or year to year), in response to changes in the environment, like warmer temperatures. With this stable isotope sampling our goal was to collect specimens from each level of the food web. This included epilimnetic (top water column) phytoplankton and primary producers using an integrated tube sampler throughout the photic zone (where there is enough light available for photosynthesis) lowered to the top of the thermocline. This water is then filtered onto a small filter back in lab and will be analyzed back in Utah. We also scraped benthic algae from some rocks and filtered it in a similar fashion. We collected benthic bugs (snails, caddisflies, and chironomids) from these rocks as well. Zooplankton were collected via horizontal net tows from the water column, which was arguably my most favorite part of this sampling. These zooplankton samples were taken back to lab and sorted under a microscope, check out the photos in “photos” tab that I captured with my phone through the eyepiece to see why I have such a passion for these little zooplankters! Fog 2 and Fog 3 had very similar zooplankton assemblages with the common cladoceran, Daphnia middendorffiana/longiremis making up most of the biomass followed by some awesome bright-red calanoid copepods (diaptomus pribilofensis), and smaller cladocerans (Bosmina longirostris) with a few large predacious calanoids (Heterocope septentrionalis) and water mites. Fun fact, the bright red color of the Diaptomus is from carotenoid pigments and is used for photoprotection. This causes an interesting tradeoff to arise, be bright red and easier to be spotted by visually foraging fish or be protected from the harmful UV rays of the sun, quite the decision for this little zooplankter. In contrast to Fog 2 & 3, the samples from Fog 5 were overwhelmingly dominated by the large predacious Heterocope, which feeds on these other smaller zooplankton and therefore occupies a higher trophic position comparably. Finally, Fog 1 had many more water mites than the other lakes. The presence of the species listed above seemed to be similar between the lakes, but the proportions of these species differed vastly. Naturally, this gets me asking…Why? Is this just random chance, or is there ecological reasoning to explain these differences? These zooplankton assemblages and benthic bugs typically change season-to-season as well as year-to-year, which is certainly something we are interested in tracking and the fish are interested in eating. As for the fish, during our standard fish sampling we take fin clips that are later analyzed for stable isotopes. As you can see, this sampling encompasses all of the pieces of the food web (at least the pieces that we know of!) which will provide us with insightful information regarding the food web structure of these lakes and how they may change overtime and in response to a changing climate. While out at the Fog lakes, we also downloaded our temperature and dissolved oxygen data from the loggers. This data gave us an idea of the thermal structure in each of our lakes over the past week and a half. It has been a warm few weeks here with regular highs in the 70’s (I thought we were in the Arctic!?). In Fog 1, we saw a rise in surface temperatures from ~14.5°C to almost 18°C in just a week and a half. This temperature was relatively constant down to about 4m where the temperature dropped about 4°C over a very short range (0.5-1m). Despite large changes in the surface temperatures, we saw very little change in the temperature of the bottom waters with the bottom 7m+ of water staying just above 4°C. This area of large temperature change over a short vertical distance around 4m deep is called the thermocline. The thermocline develops in lakes due to the difference in densities between cold and warm water and lack of mixing. This difference in densities further prevents mixing of the warm, top layer water (the epilimnion) and cold, bottom waters (hypolimnion), with the “dividing line” being the thermocline (or metalimnion), resulting in thermal stratification. Stratification may or may not develop within any given lake and is dependent upon season, temperature, mixing regimes, lake depth, and morphometry. Thus, if the water does not mix, the things in the water do not mix either, this includes all things like small organisms, nutrients, and dissolved oxygen. As you could imagine, stratification can lead to all sorts of interesting and intriguing dynamics in the water column that can affect all of its inhabitants. As for the rest of the Fogs, we saw a very similar thermal pattern as explained in Fog 1 above with surface temperatures approaching 18°C (very warm for these systems!) and the thermocline developing around 4m deep. We shall see how the thermal structures of the Fogs change in response to our warming manipulations; hopefully we see some measurable effects, i.e., warmer temperatures so we are able to gauge the responses of these lakes to a changing climate. In addition to the fun outlined above, we took more sediment cores with Kristen from Fog 5 using a pole corer from about 3m deep. As past coring, these cores will be incubated with certain light regimes in order to calculate primary production and respiration form the sediments. We also slung the large platforms that will be used to house the warming equipment to Fog 1 and Fog 5 (the warmed lakes). The slinging was accomplished by the helicopter and its great pilot, which made a nearly impossible feat, possible in a matter of minutes. Slinging via helicopters will be a regular occurrence throughout the warming project. To wrap up the week my REU and I did some fishing for the ARC-LTER site on lakes E5 (experimentally fertilized lake) and I-6 on the inlet series to Toolik. As for this upcoming week, big plans are in store and I couldn’t be more excited! Monday we plan to get down and dirty with more sediment coring from Fog 2 & 3. Then Tuesday, the moment we have been waiting for…when more members of the lake warming crew arrive, including Phaedra Budy (lead PI and my advisor), Gary T., Peter M., Sarah N., and Thomas B. For the remainder of the week we plan to set up the warming equipment and initiate the warming of Fog 1 and Fog 5. The next 2 weeks in particular will be filled with a lot of hard work and planning from all those involved, but there is no doubt that the entire team is both excited and anxious to get this underway! Thanks for tuning in to another one of my blog posts and as always feel free to comment/contact me with questions, concerns, or just to chat! Until next time, take care.  Our adventurous week started off with sampling the benthic critters (inverts, bugs, and snails) at the Fog lakes. This included eckman grabs (quantifiable “scoops” of sediment) and snorkeling transects (giving us the opportunity to elegantly slip into our stylish wetsuits to count snails). This sampling was performed at multiple sites and depths within each lake and the data will be important for understanding the food web structure and dynamics within these systems. The fish inhabiting the Fog lakes, arctic char (Salvelinus alpinus) are highly dependent on these snails (mainly Lymnaea) as their primary food source. Therefore, due to this high degree of connectivity between snails and char, alterations in the abundance of one will likely have repercussions for the other, resulting in dynamic feedback loops that are quite intriguing to any ecologist studying food webs!
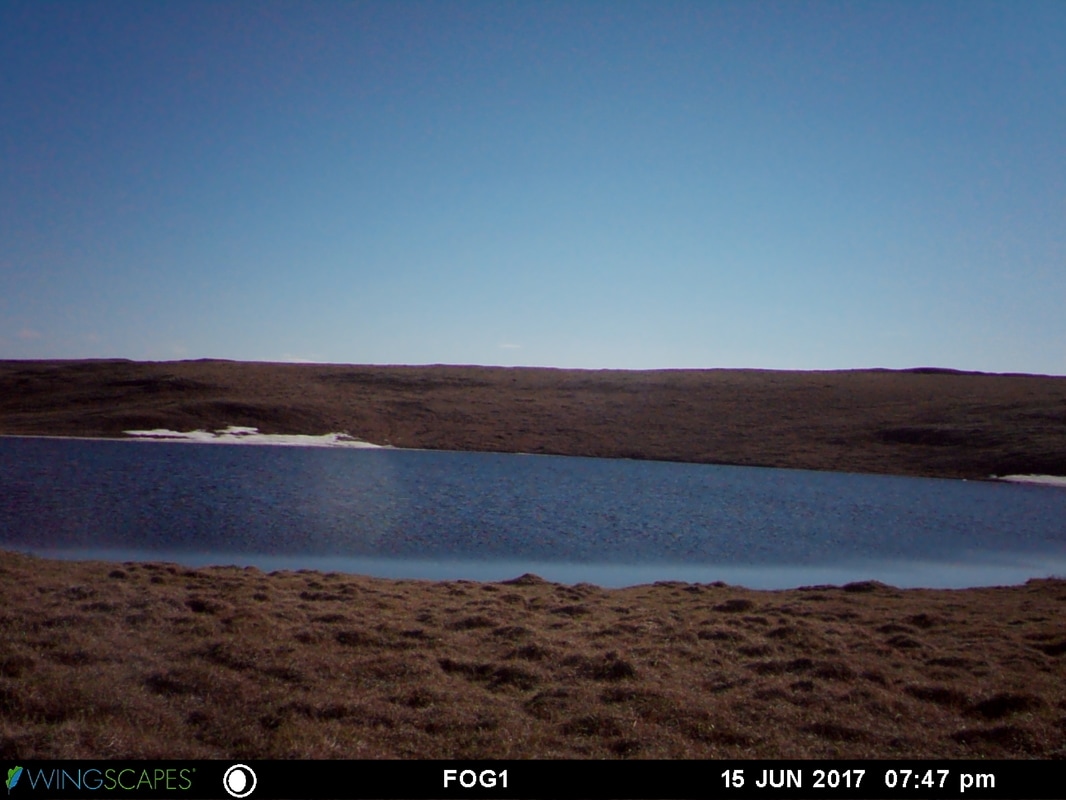
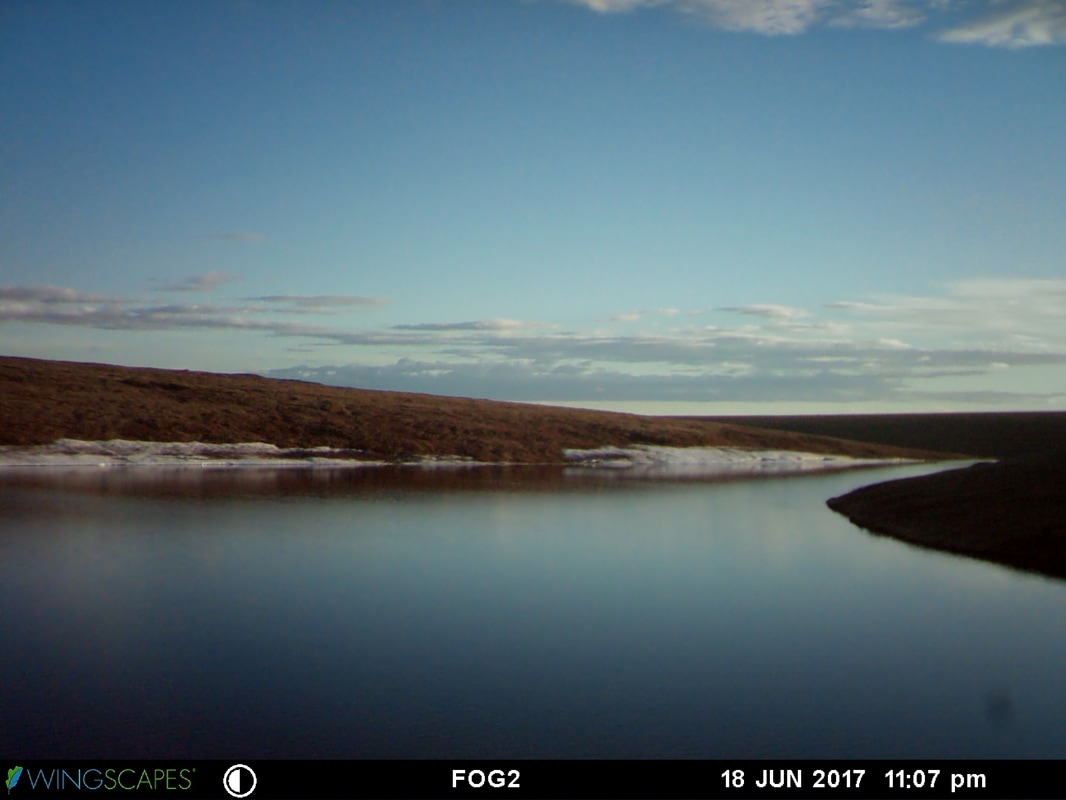
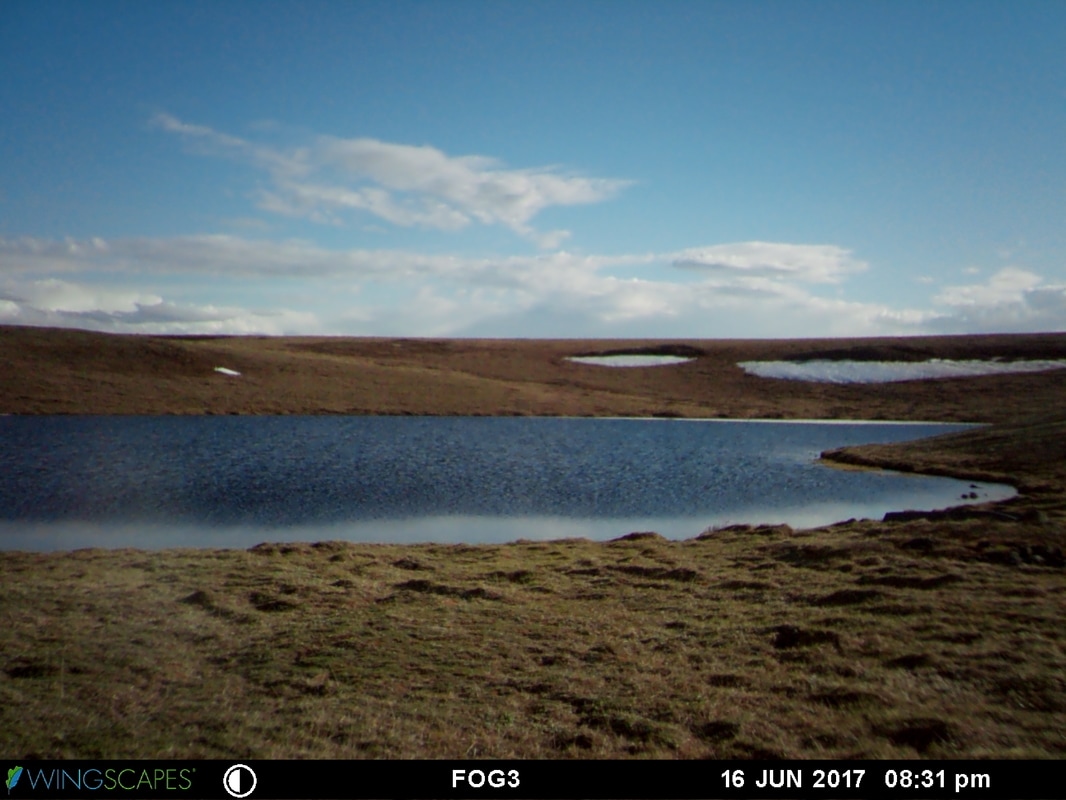
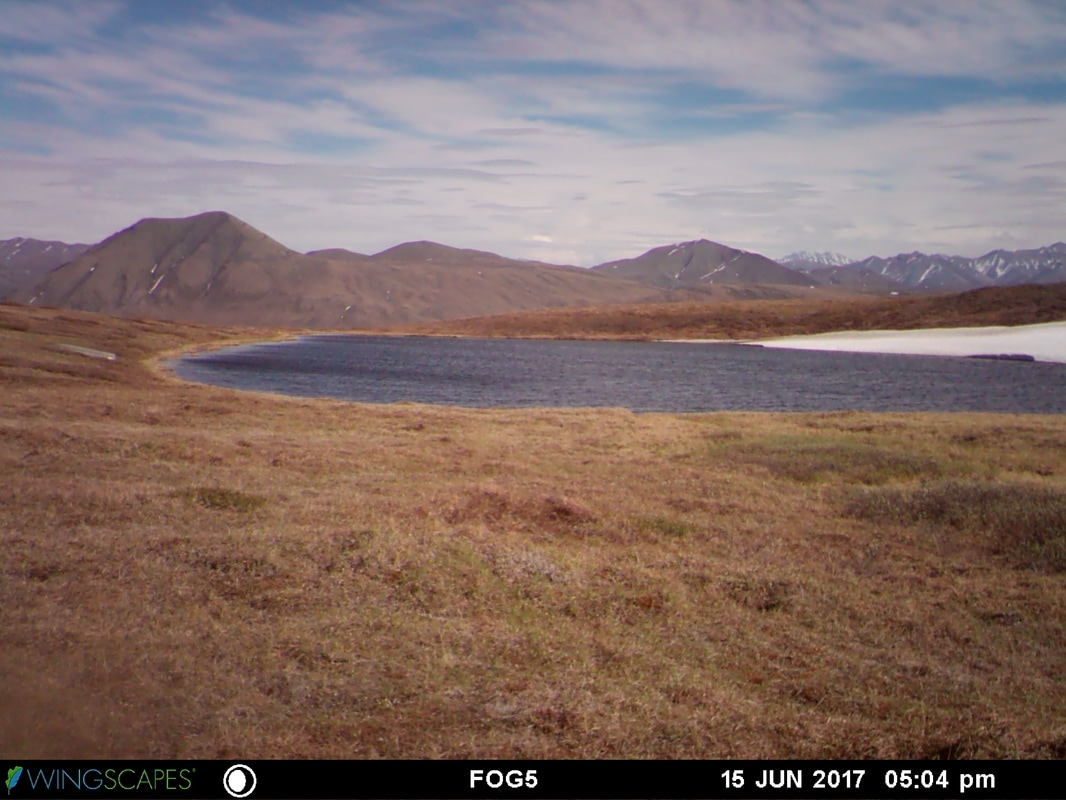
Our newly adopted snorkeling transects proved to be an effective strategy for quantifying the abundance of snails and also indirectly provided info about the fish populations within each of the lakes. For example, Fog 2 has a lower population of fish (estimated via sampling and recapture data; ~163 indv) compared to Fog 3 (~670 indv). This difference in fish abundance results in different top-down predation pressures (low in Fog 2 and high in Fog 3) that structure the lake food web. This was evident during our snorkeling transects when we counted many more snails in Fog 2 compared to Fog 3 (i.e., more fish means more predation which means less snails). Our benthic sampling will continue multiple times throughout the season as well as during future seasons within the Fog lakes. This will allow us to closely monitor and analyze alterations in both the predator (fish) and prey (snail) populations over time and how they interact and respond to our warming manipulations. After all, if you want your char to grow big and strong you gotta have the right resources available! Along with our benthic sampling at the Fogs, we also got a chance to get our hands dirty while taking sediment cores with Anne Giblin and her tech Kristen Rathbun. These sediment cores are taken from various depths around the lakes and then taken back to lab and incubated with different light regimes to investigate the respiration (oxygen uptake and production of carbon dioxide) and primary production rates (production of oxygen and uptake of carbon dioxide) of the sediments. These rates play a vital role in the carbon dynamics and overall productivity within lakes and it shall be interesting to see how our warming influences these rates. We also sampled fish on a couple of the “I-lakes” this week, gladly allowing the helicopter to chauffeur us to and from. The appropriately named I-lakes are the chain of lakes along the inlet to Toolik Lake. These lakes are connected by regularly flowing streams (making them “open” systems) and thus fish, like the arctic grayling (Thymallus arcticus), are allowed to move between these lakes. It turns out that the degree of “openness” of these arctic lake systems seems to have a strong influence in determining the fish population demographics and species diversity. A future goal of the LTER site here at Toolik is to gain a better understanding of the dynamics and differences between open and closed systems. Our fishing at the I-lakes turned up much more diversity than in the Fog lakes, which is a closed system with only arctic char and slimy sculpin (Cottus cognatus) as inhabitants. Our catch included arctic grayling, round whitefish (Prosopium cylindraceum), lake trout (Salvelinus namaycush), and even a large burbot (Lota lota). As you can see, the I-series has many interacting pieces that make up the food web puzzle, making it an exciting system to investigate. During fish sampling, when a fish is captured via hook & line or gillnetting, we record and collect multiple parameters, which include length, weight, growth, diet, and age. We also tag the fish with unique readable PIT tags, which act as a type of name or identifier for the individual fish. This is useful to track growth and survival of the individual fish over time and eventually scale up to the entire population. On the plate for next week we have stable isotope sampling, which includes collecting samples from each trophic level of the food web (benthic algae, phytoplankton, benthic critters, snails, zooplankton, and fish). With these samples we will obtain unique stable isotope (C & N) signatures from each component of the food web and use this data to get an understanding of the food web structure (who eats what). Also, we plan to set the stages (i.e., large platforms) that will eventually house our warming equipment at each of the warmed Fog lakes. Then, the next week the warming crew arrives to start our setup! By the way, be sure to check out the regularly stocked “photos” tab that highlights some of the great pictures from our time here at TFS. Informative captions for each photo are coming soon, I promise! After the long, but scenic, journey up the Dalton Highway from Fairbanks on the 28th of June, the 2017 field season has officially begun for the lake warming team up at Toolik Field Station. After spending my first two weeks at Toolik this past May for the annual LTER ice-fishing sampling, it is incredible how much the landscape has changed in that time. During Mid-May the slopes and valleys were laced with snow with the occasional brown spots sprinkled in while the lakes were covered by ~5-6 feet of ice. However, the snow on the north slope has disappeared allowing for the lush mosses, flowers, and shrubs to show their true colors resulting in a gorgeous pallet of greens with dashes of purples, pinks, and yellows. More importantly, the Fog lakes are now ice-free. Pictures (from our field cameras deployed at each lake) show the first ice-free days of the year for each of our lovely, photogenic lakes. Thus, “growing season” has officially commenced for all of the inhabitants of the Fog lakes, exciting times indeed! Although the act of warming the lakes will not begin until mid-July, there are plenty of tasks for my REU (Thomas Hafen) and I to accomplish before the warming begins and we have wasted no time in getting to it! First steps included downloading the temperature loggers that have been in the lakes over winter. Also, we installed new, more user-friendly chains (hanging from surface to the bottom) with an increased number of HOBO loggers attached for high resolution sampling of the water column temperatures. In addition, dissolved oxygen probes logging every 10 min have been deployed on these chains and wind sensors/weather stations have been added to each of the Fog lakes as well. All of these deployments will be giving us crucial high frequency data that will be useful in monitoring some of the physical effects associated with our lake warming manipulations. Another exciting note, some of our lake warming equipment has arrived to TFS after a long trek up the haul road, including the massive SolarBee® and some heat pumps. More arrivals for the lake warming team occurred this past week, including Co-PI Anne Giblin and MBL Tech Kristen Rathbun; great to have them on-site! Plans for the following week include benthic sampling (Arctic Char love the snails!) with a newly revamped protocol. We also plan to do some fishing (finally!) on the lakes along the inlet to Toolik Lake (I-Lakes) as a part of our standard LTER fish sampling. Thanks for reading my first blog post and be sure to stay tuned for the next post as our adventures continue on the North Slope of the Brooks Range! |
Author:
Nick Barrett- PhD student on Arctic Lake Warming project Check out my personal Twitter page for various tweets about the project: @WaterWorks_NB |
||
 RSS Feed
